A disclosure before the argument. We sell measurement infrastructure for humans and AI agents. That is why we notice this pattern. It is also why we tried to falsify it before publishing. Read with that lens on.
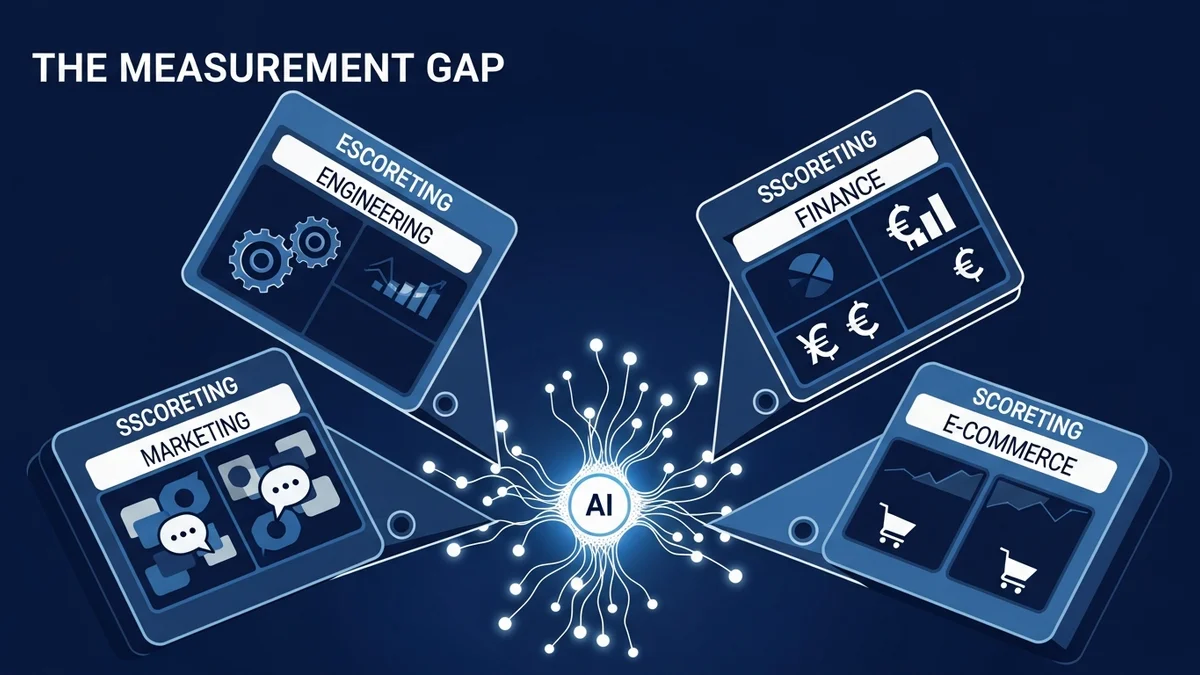
Four reports came out within the same week. Ant Murphy on enterprise AI adoption. Ben Murray on SaaS gross margin under AI load. Armando Roggio on AI-driven ecommerce traffic. Emily Kramer on how 100 B2B marketing teams are hiring. Engineering, finance, commerce, marketing. Different audiences, different vocabularies, no shared editor. Read them back to back and the same structural pattern shows up in each.
This is not a natural experiment. I curated four pieces that fit a prior thesis. A more honest framing is that these four reports, published within the week of April 17 to 21, read together, trace the same shape. I did not detect a convergence. I selected it. The reason the selection is worth publishing anyway is in the shape itself.
What each report actually says
Murphy’s chasm piece leans on McKinsey’s State of AI 2025: 88% of organizations use AI in at least one function; roughly 1% of leaders call their company “mature” on AI. Murphy frames this as Moore’s chasm applied to AI. Rhetorically effective, statistically apples-to-oranges. The 88% denominator is “any use, any intensity, any function.” The 1% denominator is “self-assessed full enterprise integration with substantial business outcomes.” A more honest middle number from the same report is the ~6 to 7% of firms that attribute more than 5% of EBIT to AI. Cite the 88/1 as Murphy’s framing, not as a headline.
Murray’s gross margin piece reports that AI-heavy SaaS products land around 52% gross margin, versus the 70 to 80% band traditional SaaS has lived in. That 52% is an ICONIQ 2026 projection from a survey of ~300 AI product executives inside ICONIQ’s growth-stage portfolio. A forecast from self-selected, VC-funded builders, not a realized or audited market average. Directionally useful, still a forecast.
Roggio’s ecommerce piece places Adobe’s data next to Kaiser and Schulze’s. Adobe, per its own analytics across roughly a trillion US retail visits, reports AI-referred traffic converts 42% better than non-AI traffic, with visitors spending 48% longer on site. Kaiser and Schulze, analyzing 164 million transactions across 973 sites ending July 2025, find ChatGPT referrals are below 0.2% of total ecommerce traffic and convert about 13% below organic search. I was tempted to call these contradictory. They are not. Adobe measures per-visit value inside a small, high-intent cohort. Kaiser and Schulze measure channel share across the full population. Both can be true. We covered the Kaiser-Schulze study earlier in AI Traffic’s Conversion Problem; this piece reads it alongside Adobe’s counter-measurement. Also note the Kaiser-Schulze dataset ends before agentic browsing went mainstream. Operator, Atlas, and Comet will undercount as referrers because they often act without sending one.
Kramer’s MKT1 piece analyzes open roles at 100 $500M-plus B2B companies. Of 507 roles, 84% of job descriptions mention AI, 18% mention agents, 6% mention LLMs. The sample is skewed toward MKT1’s high-growth B2B startup network. Do not generalize to marketing broadly. Inside that slice, the signal is that teams are hiring AI-literate operators faster than AI-literate leaders. Capacity is being bought. A measurement framework for that capacity is not.
Four data points. Four different sources. Four different ways of counting.
The shape
In every case, the method of counting is part of the finding. Murphy is measuring self-assessed maturity. Murray is measuring forecasted margin allocation under survey conditions. Adobe is measuring per-visit behavioral value. Kaiser and Schulze are measuring referrer-attributed channel share. MKT1 is measuring keyword presence in job descriptions. None of these are wrong. Each is the right lens for its own question.
Put them side by side and something becomes visible. Every organization in every report claims AI usage. None of them can isolate, attribute, or compare it on a shared scoreboard. When McKinsey says 88% use AI, the word “use” is doing most of the work. When Murray says AI margin is 52%, the word “margin” is carrying an allocation choice. When Adobe and Kaiser disagree, the word “AI traffic” is doing double duty. When MKT1 says 84% of JDs mention AI, the word “mention” is standing in for capability.
This is what I mean by a measurement gap. Not that the numbers are wrong. That the numbers are not the same kind of number.
The strongest counterargument
I said I tried to falsify this. Here is the best version of the objection.
Different functions always measure different things. CFOs care about margin. CMOs care about pipeline. PMs care about activation. Commerce leads care about conversion. That is healthy pluralism, not a governance gap. You could run this same exercise against any technology wave and produce the same “methodology divergence.”
The objection is right most of the time. The AI case is different for a narrow reason. In the pre-AI world, divergent measurement reflected a division of labor across different underlying assets. Marketing measured funnel activity. Finance measured cost structure. They were not measuring the same asset from different angles. They were measuring different assets.
AI is cross-functional by design. The same base model underwrites the marketing agent, the commerce referrer, the product feature, and the gross margin line. When four functions measure “AI” four different ways, they are measuring the same asset through four different methodologies and producing non-comparable outputs. That is new. It does not get resolved by time. It compounds.
Two other objections deserve airing. Inference prices drop roughly 10x per year, so the 52% margin gap may close without any governance intervention. Possible. Agentic workloads consume 10 to 100x the tokens of chat workloads, so the compression could also deepen. Nobody has clean data on which force wins. And the 88/1 gap is partly a denominator trick and a market-immaturity signal, not purely a governance signal. Fair. The open question is whether the cadence of AI change outruns the cadence of measurement infrastructure. For this kind of technology, historically, yes.
Why this is the argument now
The debate about whether AI works is mostly settled in the operational sense. Salesforce’s Agentforce line reported $800M ARR in Q4 FY2026, up 169% year-over-year off a small base, consuming roughly 20 trillion tokens to deliver what Salesforce calls “agentic work units.” The number is company-reported and the scope is Salesforce-defined, not GAAP. The tell is not the ARR. The tell is that Salesforce invented a unit of output to describe what was happening, because standard SaaS accounting could not.
Salesforce named its unit. Most companies have not. That is the gap.
We framed the underlying productivity divergence earlier in The AI Adoption Spectrum. Four reports this week made that divergence visible across functions inside the same organizations. We also argued in Governance Gates Enterprise AI that governance shapes adoption. What this week’s cluster adds is the shape by counterexample. When governance is absent, measurement diverges. When measurement diverges, the same underlying asset produces incompatible claims about its own value. At that point the conversation is not whether AI is working. It is whose number to believe.
The question worth asking inside your organization this quarter is narrow. When four of your functional leaders report AI impact at your next review, can you compare their numbers? If the answer is no, the gap is not capability. The gap is scoreboard.
One caution. Writing this argument is easy for anyone who sells scoreboards, including us. The argument is still right, or we would not have written it. If you read this and think “yes, we need a measurement platform,” slow down. The governance work is not the platform. The governance work is agreeing, across functions, on what gets counted and how. A shared definition beats a shared dashboard. A shared dashboard without a shared definition is four reports in a trenchcoat.
Four reports in a trenchcoat is what this week gave us. It is interesting because the trenchcoat almost fit.
This analysis draws from Ant Murphy’s “The AI Chasm” (April 2026), Ben Murray’s “Your AI Feature Is Quietly Destroying Your Gross Margin” (The SaaS CFO, April 2026), the ICONIQ 2026 State of AI bi-annual snapshot (January 2026), Armando Roggio’s “Mixed Reports on AI Ecommerce Traffic” (Practical Ecommerce, April 2026), Kaiser & Schulze’s ChatGPT referrals SSRN paper (October 2025), Salesforce Q4 FY2026 earnings (February 2026), Emily Kramer’s “State of Marketing Report (Teams Part 1)” (MKT1, April 2026), and the McKinsey State of AI 2025.
Victorino Group builds shared-scoreboard infrastructure for humans and AI agents. We sell measurement; disclosure matters. Let’s talk.
All articles on The Thinking Wire are written with the assistance of Anthropic's Opus LLM. Each piece goes through multi-agent research to verify facts and surface contradictions, followed by human review and approval before publication. If you find any inaccurate information or wish to contact our editorial team, please reach out at editorial@victorinollc.com . About The Thinking Wire →
If this resonates, let's talk
We help companies implement AI without losing control.
Schedule a Conversation